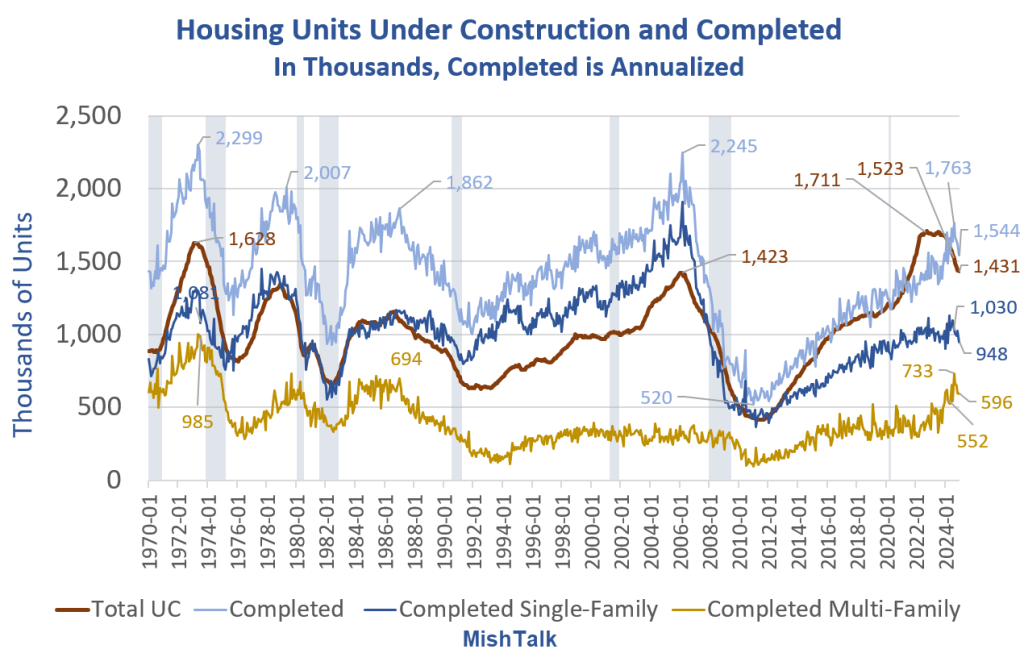
The number of housing units under construction is collapsing. Units completed for sale has peaked. What’s ahead?

Units Under Construction Details
- The number of housing units under construction has collapsed from 1.71 million to 1.43 million.
- Housing units under construction is down 16.4 percent form the recent peak. However, 1.43 million is an exceptionally high number historically, only topped in two prior surges since 1970.
- The number of multi-family units under construction has collapsed from 1.02 million to 801,000. That’s a decline of 21.5 percent.
- However, 801,000 is an exceptionally high number historically, only topped September of 1973.
- The number of single-family units is down from a recent peak of 829,000 to 641,000. This is not a particularly high or low number.
Housing Units Under Construction and Completed

The graph is a bit misleading because completed units are annualized while units under construction are not.
Housing Units Under Construction and Completed Detail

Housing units under construction is plunging fast. But it is still a massive 1.43 million.
The number of completed units (for sale or for rent) is 1.544 million (seasonally adjusted, annualized). So the real number is more like 1/12th of that, approximately 129 thousand.
The number of completed single-family units (generally for sale) is 948,000 (seasonally adjusted, annualized). So the real number is more like 1/12th of that, approximately 79 thousand. This will pressure home prices a bit, but it’s not an exceptional number historically.
The number of completed multi-family units is 596,000 (seasonally adjusted, annualized). So the real number is more like 1/12th of that, approximately 50 thousand. This is a very high number historically, relatively speaking, and may pressure condo prices or rent, but not necessarily single-family home prices.
Home Prices Rise Again, Up 50 Percent Since 2020
On December 31, I noted Home Prices Rise Again, Up 50 Percent Since 2020, Double the Increase of Rent
Would be buyers can definitely curse the Fed over this housing debacle.
Percentage Increase Since January 2020
- Case-Shiller National Index: +50.9%
- Case-Shiller 10-City Index: +50.3%
- Consumer Price Index (CPI): +21.1%
- OER is the BLS measure Owners’ Equivalent Rent, the price one would pay to rent their own house in lieu of owning it. +27.5%
- Rent of Primary Residence: +25.6%
Don’t worry. We don’t call this inflation. We pretend it’s not there or that it doesn’t matter if someone sees it.
The S&P CoreLogic Case-Shiller is a lagging indicator though.
The Case-Shiller Home Price Indices are calculated monthly using a three-month moving average. Index levels are published with a two-month lag and are released at 9 am EST on the last Tuesday of every month.
The December report is as of October, representing August, September, and October.
What About Immigration?
With millions of illegal immigrants pouring over the border (soon to stop), there has been a huge need for more shelter.
This has pressured housing prices and especially multi-family rent.
If Trump puts an immediate halt to the migration surge, the completion of 1.43 million units under construction will pressure both home prices and rent, depending of course on local conditions.
Related Posts
January 17, 2024: Housing Starts Surge 15.8 Percent, Single-Family Up 3.3 Percent
January 16, 2025: Another Strong Retail Sales Report Is a Mirage of Inflation
January 15, 2025: CPI Jumps 0.4 Percent in December, Markets Giddy Anyway
