The price of West Texas Intermediate crude bounced 6 percent from a recent low. What’s going on?

Note that Investing inverts the month and day vs US standard order. U.S. readers may find this confusing. Might I suggest an order set by location or a switch set by the user?
Fundamental or Technical Bounce?
Yes, and yes are the answers.
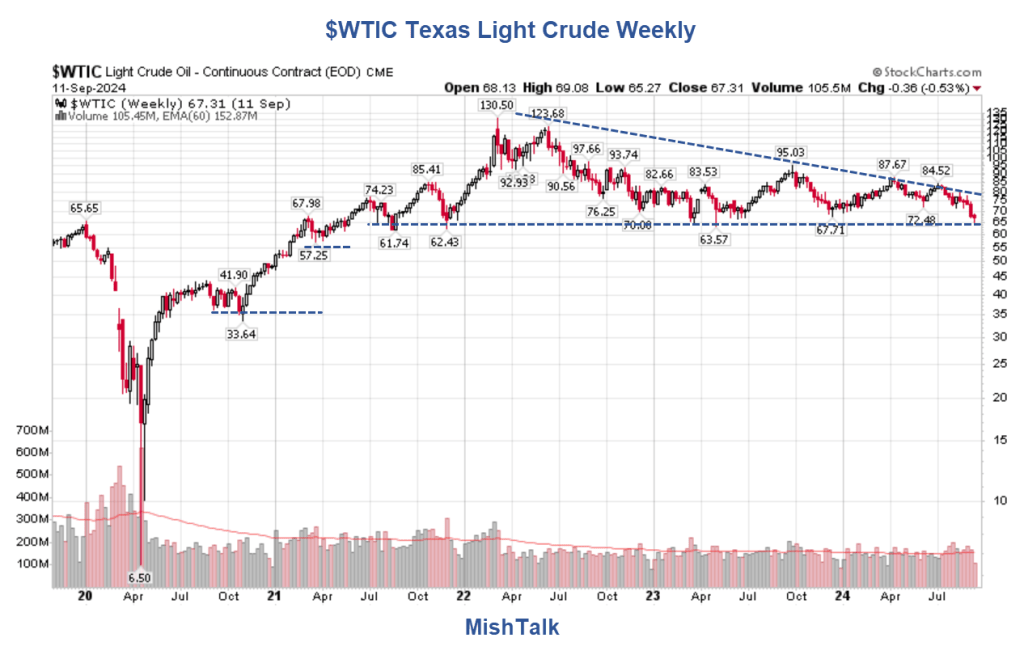
A long-term chart shows the technical picture. And the longer-term it is not pretty for crude bulls.
$WTIC Texas Light Crude Weekly Chart

If you are looking for intraday reports on commodities or futures, Investing.Com is a better source than StockCharts. I use both for various reasons.
Technically speaking, oil is on the verge of a breakdown of a low set in April of 2021. WTI has bounced off this area six times.
A descending triangle is a bearish formation. And this many retests of the same area is technical warning that one day this support level will go crashing through.
Next support on a weekly basis is ~57 then ~33.
Yikes! I doubt we get to 33. If we do, the recession will be much stronger than I expect.
What about fundamentals?
Just the Ticket!
Phil Flynn, author of the Pricegroup Energy Report, discusses the fundamentals in today’s report Just the Ticket!
The EIA reported that ‘U.S. commercial crude oil inventories increased by 0.8 million barrels from the previous week. At 419.1 million barrels, U.S. crude oil inventories are about 4% below the five-year average for this time of year. Total motor gasoline inventories increased by 2.3 million barrels from last week and are about 1% below the five-year average for this time of year. Total commercial petroleum inventories increased by 9.0 million barrels last week. The data also showed a weekly plunge in gasoline demand that fell to 8,478 million barrels since last May. At the same time distillate fuel demand dropped, with refinery runs also declining.
The recent crash in oil prices, that is really out of touch with current supply and demand fundamentals, is raising eyebrows as to the influence of the commodity hedge funds and the price of oil. Even as the International Energy Agency warns about slowing global oil demand growth today, they must acknowledge that global observed oil stocks declined by 47.1 mb in July. The drawdown was concentrated in crude oil, NGLs and feedstocks (-75.5 mb), while oil products built to their highest level since January 2021. OECD industry stocks fell counter-seasonally by 12.3 mb in July to stand 78.5 mb below the five-year average. Preliminary data show continued stock declines in August.’
Today, the Energy Information Administration (EIA) reported relatively low inventories for this time of year.
This happened right at technical support. Short covering led to a 6 percent bounce from the recent low.
What About Longer Term?
Is the price of oil totally disconnected with reality or are the hedge funds signaling something more ominous? The bearish case is that we’re going into a recession. And based on the market sentiment coming out of the Labor Day break, it might be the mother of all recessions.
The other bearish case is that even though OPEC is showing great signs of compliance, non-OPEC oil production may rise to offset the discipline by the old cartel. Even though currently the world is in a supply deficit as demand for oil is at a record high and supply supplies are falling, the IEA is calling for that to reverse. The hope is that that the supply deficit will reverse and we will see production exceeds supply. That would create an oil supply deficit and potentially replenishing stocks that are pretty much below average across most of the world.
The IEA is always trying to justify its call to stop investing in today fossil fuels. The IEA reports, “Global oil demand growth continues to decelerate, with reported 1H24 gains of 800 kb/d y-o-y the lowest since 2020. The chief driver of this downturn is a rapidly slowing China, where consumption contracted y-o-y for a fourth straight month in July, by 280 kb/d. Average annual gains of 900 kb/d in 2024, compared to 2.1 mb/d last year, will take demand to almost 103 mb/d. An increase of 950 kb/d in 2025 will be equally subdued.”
You can sign up for the energy and other futures reports at Price Futures Group.
The reports are free. I get nothing in return for providing the above link. Sign up for the futures reports that you wish to see,
Recession When?
Phil Flynn asks the right question: “Is the price of oil totally disconnected with reality or are the hedge funds signaling something more ominous?”
The Fed’s Beige Book and a recession indicator with no false negatives or positives provide all the clues you need.
Beige Book Conditions
Note that Fed Beige Book Conditions Are Worse Now Than the Start of the Great Recession.
The current economic headline conditions [from 12 Fed districts] are worse than the conditions heading into the 7th month of the Great Recession.
The McKelvey Recession Indicator Triggered in August
What is the McKelvey Recession Indicator?
Take the current value of the 3-month unemployment rate average, subtract the 12-month low, and if the difference is 0.30 percentage point or more, then a recession has started.
Edward McKelvey, a senior economist at Goldman Sachs, created the indicator. The problem with the indicator is that it has many false positives.
Improvements to the model by Pascal Michaillat and Emmanuel Saez (PMES), economists at the University of California in Santa Cruz, eliminate all false negatives and all false positive dating to 1951.
What Are the Odds of Recession?

I discussed the PMES improvements and suggested a better way of calculating recession odds in The McKelvey Recession Indicator Triggered, But What Are the Odds?
I calculate odds that a recession is currently underway at well over 50 percent.
The long-term oil chart also suggests weakening demand with a recessionary outlook.
