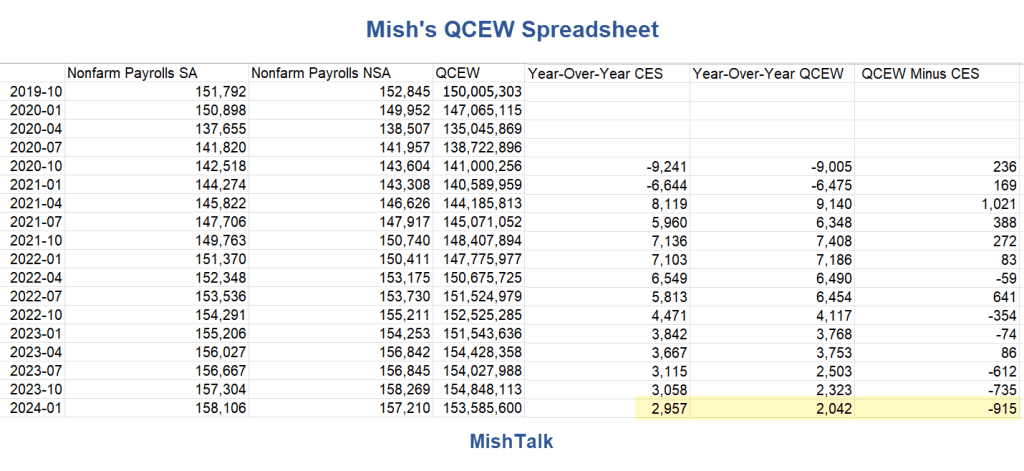
I calculated -915,000. Every headline said -818,000. I finally gave up and posted 818,000 but noted a discrepancy. I believe it’s -915,000.

Using BLS QCEW data, I calculated a year-over-year decline of 915,000 jobs.
I delayed my post this morning for hours trying to match 818,000. I gave up, reported 818,000 but also posted the above chart from my calculation.
Moments ago, I received a note confirming my calculation.
Note from Conrad Dequadros of Brean Capital
There is more that goes into the prelim. benchmark revision estimate than just QCEW and we are still waiting for the BLS to update its page summarizing this estimate, but the QCEW is out and it shows not seasonally adjusted employment in the 12-months through March 2024 at 2.042 million versus NSA payrolls at 2.957 million (i.e., 915K lower)
The above via email.
I delayed my post figuring I missed a revision somewhere. I kept downloading QCEW data directly waiting for a change that never came.
Here is my post this morning: BLS Revises Jobs Down by 818,000 the Most Ever, About 68,000 Per Month
Do I get to say I told you so? My advance estimate a month ago was 779,000 lower. Bloomberg estimated 730,000.
Apologies for being overly optimistic.
I am struggling to match 818,000 this morning. Using unadjusted numbers, I calculate a discrepancy of 915,000.
68k downward revision per month on average. (My estimate is higher).
My “most ever” headline may be incorrect. 2009 may have been higher, but I would like to see a consistent calculation of seasonal vs unadjusted numbers.
For the record, I estimated -779,000 in advance vs -730,000 by Bloomberg.
On July 26, 2024 I commented Expect the BLS to Revise Job Growth Down by 730,000 in 2023, More This Year
Apologies for being overly optimistic.
Mish’s QCEW Spreadsheet

How Do We Get 818,000?
I believe 818,000 was first reported by Bloomberg, then copied everywhere by everyone with few questioning the number.
Five Possibilities
- The BLS created a seasonally-adjusted number and gave it to Bloomberg without publishing it.
- The BLS published 818,000 but where?
- Bloomberg made an estimate of the seasonally-adjusted number and reported it, without specifying it is their adjustment. Everyone copied the without question.
- Bloomberg or whoever was first in reporting 818,000 made a bad calculation using a mix of seasonally-adjusted and unadjusted numbers.
- Something else, but what?
The problem with #4 is that I cannot arrive at 818,000 no matter how I mix the numbers. Am I missing something?
Option #1 is the most interesting.
Who is it that would want to make this revision as small as possible?
I am not saying that is the answer. I am open to all of the other options, including #5 “Something else, but what?”.
Regardless, I am now confident my calculation is correct.
Nonfarm Payrolls Seasonal Adjustments
Unadjusted numbers are generally worse in Q1 because of strong seasonal layoffs in January.
So, I am not saying 818,000 is necessarily wrong, I just want to know how we got the number and why everyone copied it without question. Also if it is a seasonal adjustment someone should say so,
Did the BLS go out of its way to report an out-of-the-ordinary unpublished seasonal adjustment?
That may or may not be it. I just want to know how we got there.
In my previous post, I stated “68k downward revision per month on average. (My estimate is higher).”
My estimate is easy: 915,000 / 12 = -76,250 (on average, year-over-year), but that is unadjusted. I do not have a seasonally adjusted number but an adjusted number would definitely be higher (less negative).
Regardless there are several important points of note.
Five Important Points
- The Fed is setting fiscal policy based off incredibly bad sets of numbers.
- The market is reacting to incredibly bad sets of numbers.
- The Congressional Budget Office is making calculations based off incredibly bad sets of numbers.
- Personal income and Gross Domestic Income will be revised downward
- The personal saving rate will be reduced from its already very depressed level of 3.5 percent.
Those are the bottom-line implications no matter what number you believe.
Don’t tell me that +2,042,000 million jobs year-over-year (yellow highlight in above chart) is such a great number.
2024 Q2 and 2024 Q3 numbers will be increasingly poor. There have been negative revisions in nearly all economic reports.
This is a very recessionary trend. It looks bad because it is bad.
Improving the McKelvey Recession Indicator, No False Negative or Positive Signals
Yesterday, I commented Improving the McKelvey Recession Indicator, No False Negative or Positive Signals
Adding the job vacancy rate to the McKelvey (Claudia Sahm) recession signal eliminates false negatives and false positives, and provides a much faster signal than Sahm.
Since 1953, every time the economy was in the current state, the economy was in recession.
That does not make the odds 100 percent because everything is up to the NBER, the official arbiter of recessions.
My recession post is on the complicated side, but please check it out.
