Consumers went on a huge buying spree in March with upward revisions to February. Online sales surged 2.7 percent.

Advance Retail Sales Detail
- Advance estimates of U.S. retail and food services sales for March 2024, adjusted for seasonal variation and holiday and trading-day differences, but not for price changes, were $709.6 billion, up 0.7 percent from the previous month, and up 4.0 percent above March 2023.
- Total sales for the January 2024 through March 2024 period were up 2.1 percent from the same period a year ago.
- Retail trade sales were up 0.8 percent from February 2024, and up 3.6 percent above last year.
- Nonstore retailers were up 11.3 percent from last year, while food services and drinking places were up 6.5 percent from March 2023.
Unexpectedly Hot
Sales unexpectedly hot in March, up 0.7 percent vs a Bloomberg Econoday consensus of 0.4 percent.
And the Census Department revised February to +0.9 percent from +0.6 percent
After a bad January, consumers went all out in February and March.
Those are nominal totals. Real (inflation-adjusted sales) were also on the hot side.
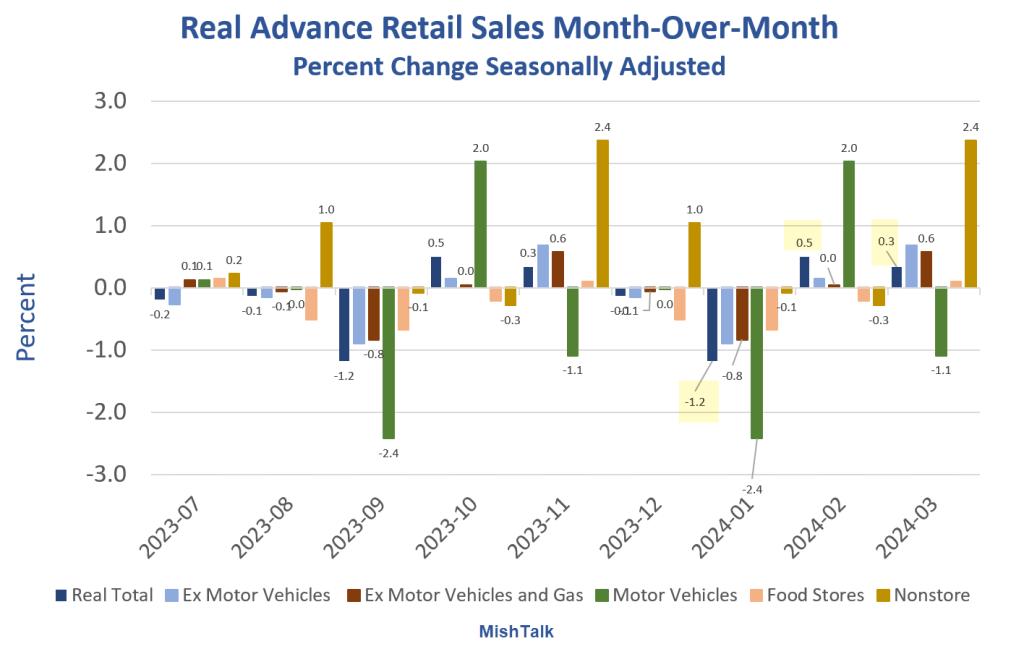
Real Advance Retail Sales Percent Change Month-Over-Month

In real (inflation-adjusted) terms. sales rose 0.3 percent in March, and 0.5 percent in February, after declining 1.2 percent in January.
Advance Retail Sales Major Categories

Winners and Losers for the Month
- Total Sales: +0.7%
- Excluding Motor Vehicles and Parts: +1.1%
- General Merchandise: +1.1%
- Food Stores: +0.5%
- Food Service: +0.4
- Motor Vehicles and Parts: -0.7%
- Department Stores: -1.1%
- Nonstore Retailers: +2.7%
- Gas stations: +2.1%
In general, people bought more of about everything but cars and they did so online.
Bond Yields Surge

If you are a bond market bull, it’s been a tough month. Let’s review what happened, why, and what’s ahead.
On April 12, I noted It’s Been a Bloody Month for Bond Market Bulls
As you might expect, the carnage continued today.
US Treasury Yields
- 30-year: 4.74 vs 4.64 in the above chart
- 10-year: 4.65 vs 4.55 in the above chart
- 5-year: 4.66 vs 4.61 in the above chart
- 2-year: 4.98 vs 4.97 in the above chart
The CPI Rose Sharply in March
Yields rose sharply on April 10 on news The CPI Rose Sharply in March Led by Shelter and Gasoline
Yields are up again today, killing a small rally since the CPI news.
I warned about pending bond market carnage on April 3 in Ominous Technical Trends for US Treasury Bulls, Three Durations
