Producer prices rose more than expected in November with upward revisions to October.

The BLS report the Producer Price Index was rose 0.4 percent in November on top of an upward revision for October.
PPI Final Demand Key Detail Month-Over-Month
- PPI: +0.4 Percent
- Services: +0.2 Percent
- Goods: +0.7 Percent
- Excluding Food and Energy: +0.2 Percent
- Food: +3.1 Percent
- Energy: +0.2Percent
Goods Details
- Final demand goods: The index for final demand goods moved up 0.7 percent in November, the largest increase since rising 1.1 percent in February.
- Eighty percent of the broad-based advance in November can be traced to prices for final demand foods, which jumped 3.1 percent.
- A quarter of the November rise in prices for final demand goods is attributable to a 54.6-percent jump in the index for chicken eggs.
- Prices for fresh and dry vegetables, fresh fruits and melons, processed poultry, non-electronic cigarettes, and residential electric power also increased.
- In contrast, the index for oilseeds declined 4.7 percent. Prices for diesel fuel and for primary basic organic chemicals also decreased.
Services Details
- The index for final demand services rose 0.2 percent in November, the fourth consecutive increase. Leading the advance in November, margins for final demand trade services moved up 0.8 percent.
- The index for final demand services less trade, transportation, and warehousing rose 0.1 percent. Conversely, prices for final demand transportation and warehousing services fell 0.5 percent.
- Over one-third of the advance in prices for final demand services can be traced to margins for machinery and vehicle wholesaling, which increased 1.8 percent.
- The indexes for securities brokerage, dealing, and investment advice; automotive fuels and lubricants retailing; food wholesaling; food and alcohol retailing; and apparel, footwear, and accessories retailing also rose.
- In contrast, prices for airline passenger services declined 2.1 percent. The indexes for guestroom rental and for computer hardware, software, and supplies retailing also decreased.
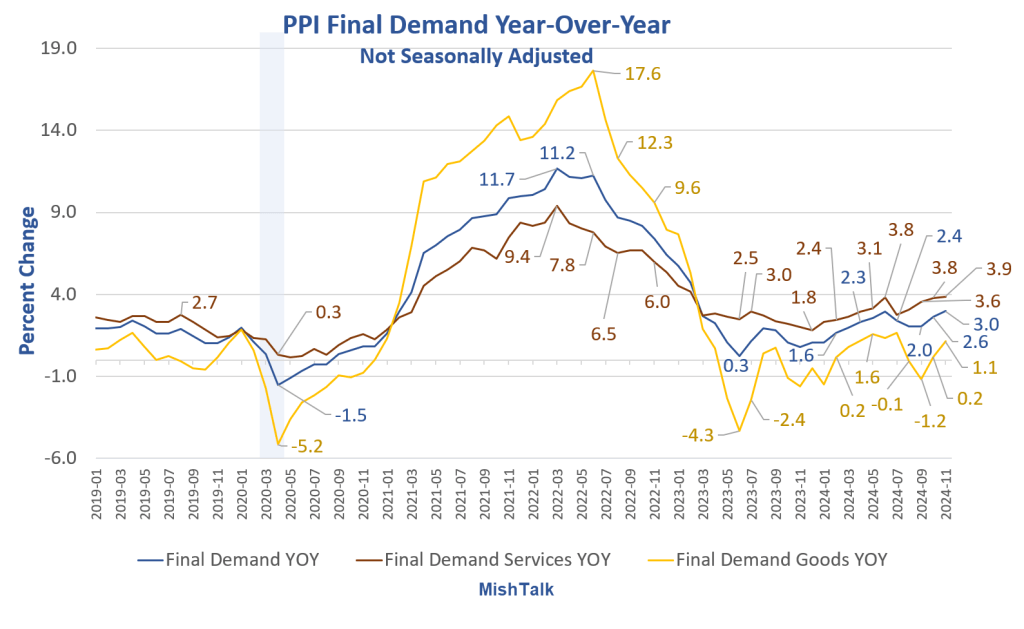
PPI Year-Over-Year

PPI Final Demand Year-Over-Year Details
- PPI: +3.0 Percent
- Goods: +1.1 Percent
- Services: +3.9 Percent
- Food: 5.1Percent
- Excluding Food and Energy: 3.4 Percent
- Energy: -6.2
The year-over-year trends are moving up sharply despite a big decline in energy.
PPI Final Demand Services

PPI Services are 67.2 percent of the PPI. A strong uptrend started in January.
The CPI Rises 0.3 Percent in November, Rate Cut Odds Jump Anyway
On December 11, I noted The CPI Rises 0.3 Percent in November, Rate Cut Odds Jump Anyway
Neither the CPI nor the PPI reports should inspire confidence in a mass of rate cuts by the Fed.
Nonetheless a rate cut is priced in for December, January, and a third one in March.