Pending home sales, a leading indicator of existing home sales, rose 2.2 percent in November, but don’t get excited.

Pending Home Sales Up 2.2% in November
The National Association of Realtors reports Pending Home Sales Moved Up 2.2% in November, Fourth Straight Month of Increases
The Pending Home Sales Index (PHSI) – a forward-looking indicator of home sales based on contract signings – advanced 2.2% to 79.0 in November. Year-over-year, pending transactions improved 6.9%. An index of 100 is equal to the level of contract activity in 2001.
“Consumers appeared to have recalibrated expectations regarding mortgage rates and are taking advantage of more available inventory,” said NAR Chief Economist Lawrence Yun. “Mortgage rates have averaged above 6% for the past 24 months. Buyers are no longer waiting for or expecting mortgage rates to fall substantially. Furthermore, buyers are in a better position to negotiate as the market shifts away from a seller’s market.”
Pending Home Sales Regional Breakdown
The Northeast PHSI fell 1.3% from last month to 67.8, up 5.6% from November 2023. The Midwest index increased 0.4% to 78.1 in November, up 1.6% from the previous year.
The South PHSI improved 5.2% to 94.5 in November, up 8.5% from a year ago. The West index rose by 0.5% from the prior month to 64.3, up 11.8% from November 2023.
“It appears that some markets will outperform, driven primarily by local job gains and the flow of new inventory supply,” explained Yun.
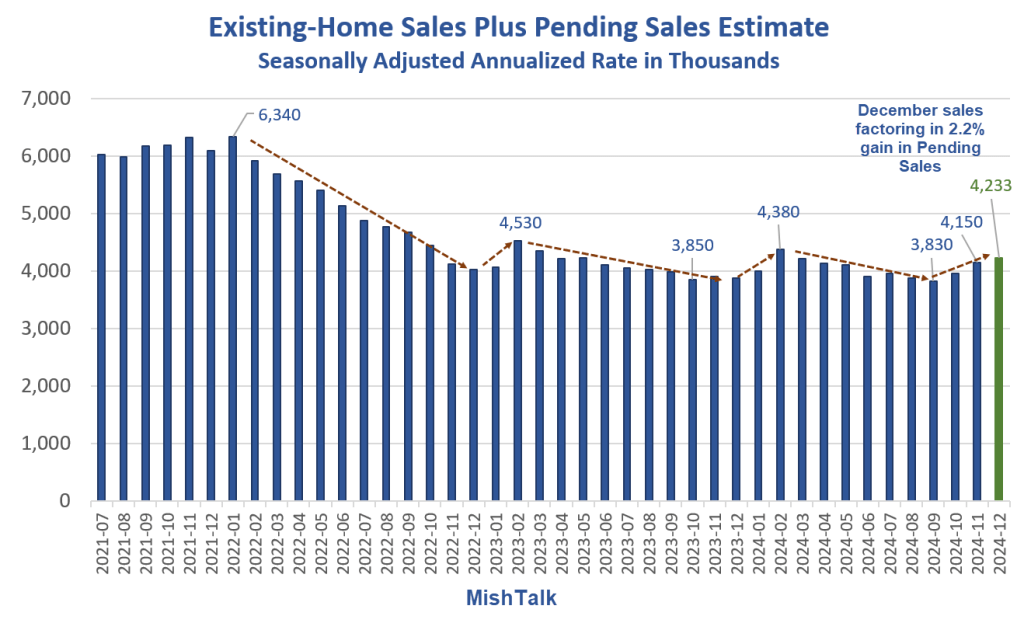
Pending home sales will generally translate to existing home sales in one or two months.
The following chart assumes all of the sales will happen in December and the data won’t be revised.

It appears as if the bounce may be a normal seasonal thing and nothing to get excited about.
Let’s add some perspective with a long-term look.
Existing Home Sales Since 1968

Existing home sales are about where they were in January of 1994 and November of 1978.
Lawrence Yun says “Consumers appeared to have recalibrated expectations regarding mortgage rates and are taking advantage of more available inventory.”
Closer inspection of the second shows sales have gone nowhere for two years.
We had a 3-month bounce at the beginning of 2022 and a bounce in 3 of 4 months at the start of 2024.
Perhaps this one keeps going but I am more than a bit skeptical.
Housing Boom-Bust
Housing has been in a boom bust cycle ever since the Fed launched its massive QE program.
And since the Fed started hiking housing transactions have crashed. There is no reason to believe what ails housing is now fixed.
An Update on the Fed’s Snail Pace QT Balance Sheet Reduction
On December 27, I gave An Update on the Fed’s Snail Pace QT Balance Sheet Reduction
Every month since April of 2022 the Fed has been slowly unwinding QE that it should not have done in the first place.
Two Recession Indicators, What Do They Say Now?
On December 20, I noted Two Recession Indicators, What Do They Say Now?
A pair of very reliable Indicators still suggest recession.
But will it be a stagflation recession with higher interest rates or will it be a deflationary recession?
How about no recession at all with Trump blasting inflation higher until the Fed acts to force one?
All of the above are possible outcomes.
