If you are a bond market bull, it’s been a tough month. Let’s review what happened, why, and what’s ahead.

Yield Change In Past Month
- 2-year: +49 Basis Points
- 5-Year: +55 Basis Points
- 10-Year: +46 Basis Points
- 30-Year: +38 Basis Points
And to add more injury, 30-year mortgage yields rose from 6.87 percent to 7.37 percent as of yesterday, down to 7.30 percent today according to Mortgage News Daily.
That’s a rise of 43 basis point from a month ago to today.
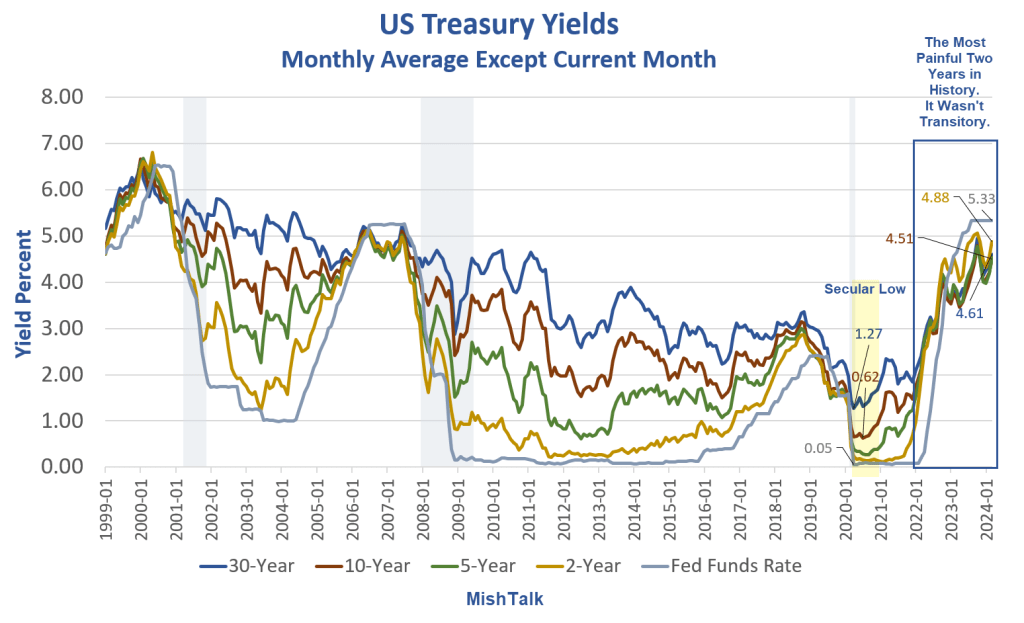
US Treasury Yields Monthly Average

This is the worst bond market selloff ever in percentage terms.
For over two years I have heard nonsense about rent, Owners’ Equivalent Rent (OER), etc. and how it’s “lagging”.
OK but lagging to where?
Ominous Technical Trends
On April 3, I noted Ominous Technical Trends for US Treasury Bulls, Three Durations
Technical patterns on 2-year, 10-year, and 30-year US treasuries all suggest yields are heading higher.
The yield on the 2-year note was 4.7 percent at the time. Yesterday it hit 4.97 percent. The technical pattern broke in the expected direction.
The CPI Rose Sharply in March
The CPI rose 0.4 percent in March. Rent is up another 0.4 percent in March with gasoline up 1.7 percent. Together, the pair was about half of the total rise.

For discussion of the above chart, please see The CPI Rose Sharply in March Led by Shelter and Gasoline
Yet Another Groundhog Day for Rent
I repeat my core key theme for over two years now. People keep telling me rents are falling, I keep saying they aren’t.
Rent of primary residence, the cost that best equates to the rent people pay, jumped another 0.4 percent in March. Rent of primary residence has gone up at least 0.4 percent for 31 consecutive months!
The “rents are falling” (or soon will) projections have been based on the price of new leases and cherry picked markets. But existing leases, much more important, keep rising.
Only 8 to 9 percent of renters move each year. It’s been a huge mistake thinking new leases and finished construction would drive rent prices.
The overall CPI and core CPI Joined the party this month, all rising 0.4 percent.
Not Transitory
For at least a year, with nearly all the analysts telling me that rent is lagging and we were headed for a soft landing, my view has been the decline in the rate of inflation is what’s been transitory.
CPI Year-Over-Year

We have heard nonsense about a soft landing for a year.
In June, the year-over-year CPI fell to 3.0 percent. Since then it’s been trending higher.
Allegedly that’s OK because “rent is lagging”, a message we have heard for 2 straight years!
I keep asking, lagging to where?
CPI Month-Over-Month Rent and OER

OER stands for Owners’ Equivalent Rent. It is the price people would pay to rent a house unfurnished, without utilities.
People keep repeating the myth that OER is based off the question “If someone were to rent your home today, how much do you think it would rent for monthly, unfurnished and without utilities?”
That is false. Rather, that silly question is used to help set CPI weights, not prices. Prices are real measured prices of rent.
Treasury Yields
Let’s investigate US treasury debt issuance by month and year.

For discussion, please see How Much Treasury Issuance Does the US Add Every Month to Finance Debt?
Pending in Congress
President Biden along with warmongers in both parties want to spend another $100 billion on Ukraine and Israel with no strings attached.
What’s Ahead?
Rather than woodenly pointing out month-after-month that rent is lagging (it is, but to where) please ponder a few things.
- The Inflation Reduction Act (IRA) is inflationary.
- Biden’s energy policy is inflationary.
- Biden’s regulations are inflationary.
- Both Trump’s and Biden’s tariffs are inflationary.
- The pending increase in the Child Tax Credit, approved by House Republicans and universally supported by Democrats, is inflationary.
- Biden’s student debt cancelation escapades are inflationary.
What About Demographics?
Due to age demographics, I expect employment in age groups 60 and over to decline by about 12.5 million.

I go over the math as to how I arrived at 12.5 million in my post In the next 5 years employment in age groups 60+ will drop by ~12.5 million
Three Key Implications
- Expanded need for more Medicare
- Expanded Social Security payments
- Decreasing productivity as boomers are replaced by unskilled zoomers
All three points are inflationary.
There are some deflationary aspects as well, For example, boomer deaths will create an increase supply of homes for sale by heirs, but that comes later.
The inflationary aspects are here and now.
The Fed’s Big Problem
In case you missed it, please see The Fed’s Big Problem, There Are Two Economies But Only One Interest Rate
Summation
The inflationary pressures include demographics, the IRA, energy policy, regulations, tariffs, child tax credits unless the Senate kills that, and another unconstitutional push by Biden for student debt cancellation.
That is counterbalanced by the phrase of the day: “Rent is lagging.”
I don’t doubt one bit that a recession is coming. But the ensuing decline in inflation, if any, will be transitory for all of the reasons stated above.
