The word of the day is revision. The Census Department revised housing starts and permits all the way back to 2017.

New Residential Construction
Please consider the New Residential Construction Report for April 2024.
Notice of Revision: With this release, unadjusted estimates of housing units authorized by building permits for January 2022 through December 2023 have been revised. Also, seasonally adjusted estimates of housing units authorized by building permits have been revised back to January 2017, and seasonally adjusted estimates of housing units authorized but not started, started, under construction, and completed have been revised back to January 2019.
Revision Notes
- In percentage terms some of the revisions are significant. However, they are also random and offset. The sum of the revisions is tiny.
- I like the fact that the Census Department back revises charts. The BLS does not do this making the monthly jobs reports historic garbage.
The following charts reflect the back revisions. The BLS does not include annual revisions in its monthly jobs report series. It’s a serious BLS reporting error.
Housing Starts, Permits, Completions

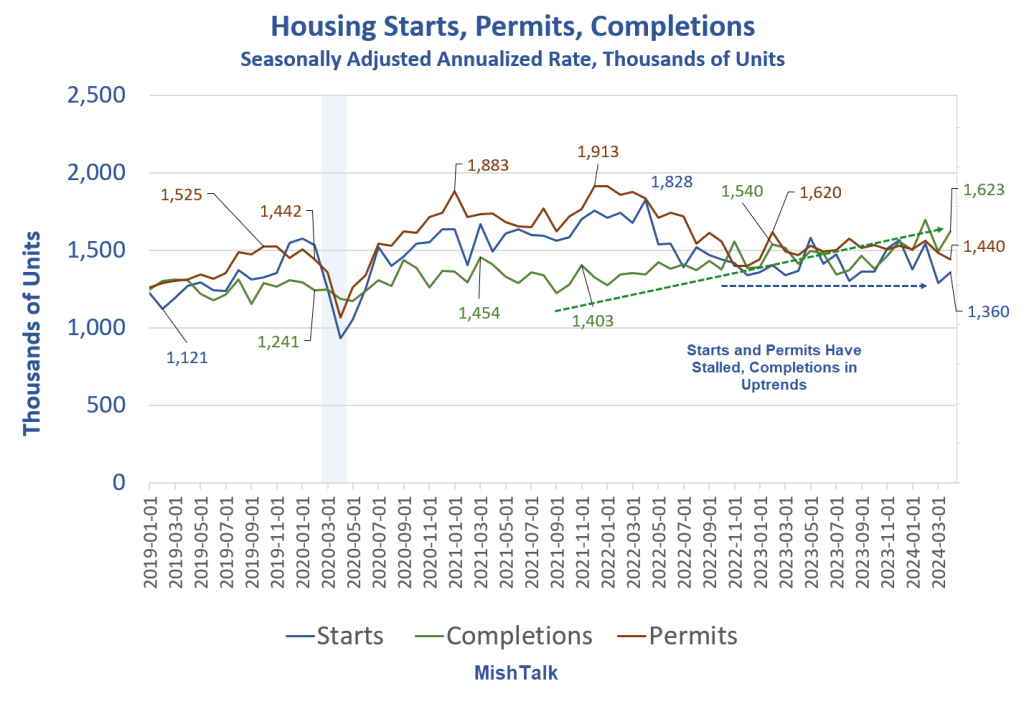
Starts and permits took a huge dive since late 2021 and early 2022 until January 2023. Since then it’s bee meaningless random month-to-month fluctuations.
Completions bottomed in September of 2021 at 1,226 and are now at 1,623. Expect this trend to continue for a while. It will help the rent situation, but there are upward pressures as well.
But bear in mind these are all annualized rates. It’s a slow slog.
Building Permits
- Privately‐owned housing units authorized by building permits in April were at a seasonally adjusted annual rate of 1,440,000.
- This is 3.0 percent below the revised March rate of 1,485,000 and is 2.0 percent below the April 2023 rate of 1,470,000.
- Single‐family authorizations in April were at a rate of 976,000; this is 0.8 percent below the revised March figure of 984,000. Authorizations of units in buildings with five units or more were at a rate of 408,000 in April.
Housing Starts
- Privately‐owned housing starts in April were at a seasonally adjusted annual rate of 1,360,000.
- This is 5.7 percent above the revised March estimate of 1,287,000, but is 0.6 percent below the April 2023 rate of 1,368,000.
- Single‐family housing starts in April were at a rate of 1,031,000; this is 0.4 percent below the revised March figure of 1,035,000. The April rate for units in buildings with five units or more was 322,000.
Housing Completions
- Privately‐owned housing completions in April were at a seasonally adjusted annual rate of 1,623,000.
- This is 8.6 percent above the revised March estimate of 1,495,000 and is 14.6 percent above the April 2023 rate of 1,416,000.
- Single‐family housing completions in April were at a rate of 1,092,000; this is 15.4 percent above the revised March rate of 946,000. The April rate for units in buildings with five units or more was 516,000.
Permits are 2.0 percent below a year ago. Starts are 0.6 percent below a year ago. Completions are 14.6 percent above a year ago.
Housing Starts 1959-Present 2024-04

Housing starts are below where they were in 1959. This is not exactly a strong market.
CPI Up 0.3 Percent With Rent Still Rising Steeply, Food a Bright Spot
Rent rose another 0.4 percent in April. Food and beverages were flat with food at home declining but food away from home rising.

For discussion, please see CPI Up 0.3 Percent With Rent Still Rising Steeply, Food a Bright Spot
I will go over the positive and negative pressure impacting rent in a follow-up post.
