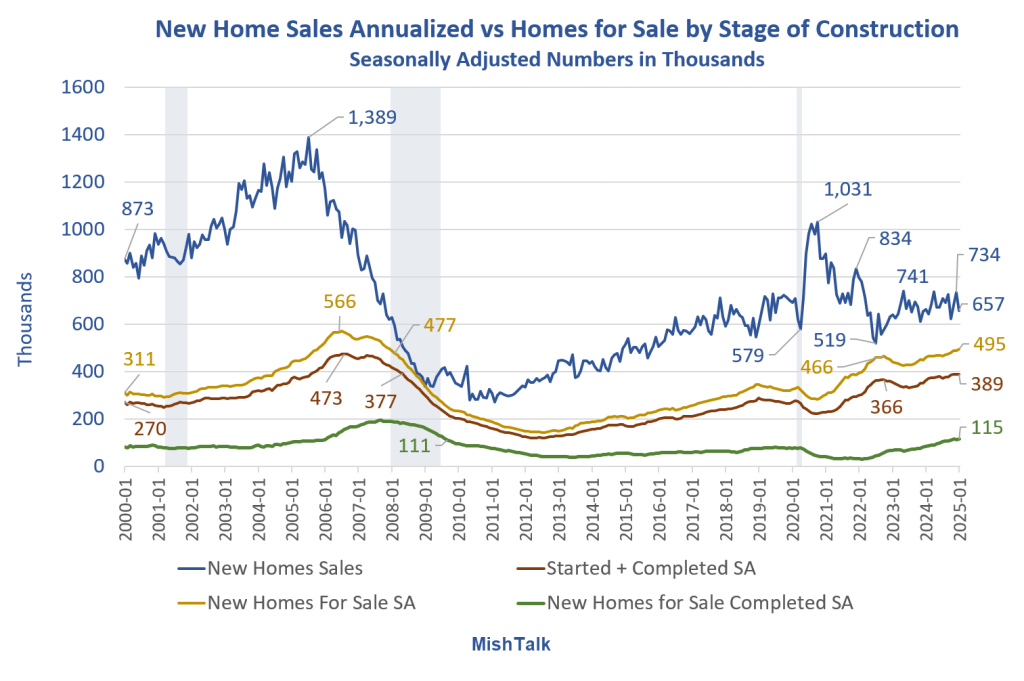
Homebuilder inventory of started and completed homes is soaring but sales are weak.

New Homes for Sale by Stage of Construction
- Total: 495,000. The most since December 2007.
- Started Plus Completed: 389,000. The most since May 2008.
- Under Construction: 274,000
- Completed: 115,000. The most since August 2009.
- Not Started: 106,000
Not started means vacant land. Started, and especially completed, represent speculative building.
New Home Sales Annualized vs Homes for Sale Detail

New home sales are seasonally adjusted and annualized totals. The stage of construction numbers are seasonally adjusted but not annualized.
New Homes for Sale as Percent of New Home Sales

Elevated for Sale Numbers
- Total: 75 Percent
- Under Construction or Complete: 59 percent
- Completed: 18 percent
The above is a new chart I added just today.
Amusingly, in the middle of the Great Recession, there were more homes for sale than the annualized number of new home sales. That number includes homes not started.
Not started homes represent a land commitment, whereas started and completed homes represent heightened speculation.
Unfortunately, this data series only dates to 1999, but the current numbers appear very elevated compared to the data we do have.
This rates to pressure prices unless demand picks up.
Note: The above charts and commentary pertain to new single-family homes. The following data represents all units under construction including multifamily.
Housing Units Under Construction

Housing Units Under Construction Detail

The number of units under construction is rapidly falling. It’s down from 1.71 million to 1.41 million, a decline of 17.7 percent.
In the Great Recession, the number of completed units topped at 1.42 million. So, this is a very elevated number.
However, most of this is multi-family in stark contrast to the Great Recession.
What’s Happening?
We are building apartments for immigrants who are here (legally or illegally) and others who aren’t going to get here because Trump effectively closed the border.
Completed units have not yet impacted the price of rent, at least renewals. How long can that last?
Related Posts
February 19, 2025: Housing Starts Drop 9.8 Percent, Unable to Retain Any Traction
Housing starts have mostly been rangebound since late 2022 as high prices and high mortgage rates dampen demand.
February 21, 2025: Student Loan Borrowers Crushed by Appeals Court Ruling, Credit Scores Plunge
The courts are busy. This one goes against Biden. Economic repercussions are significant.
February 21, 2025: Existing-Home Sales Drop 4.9 Percent in January, More Than Expected
After three months of increases, sale took a big dive in January.
February 25, 2025: US Consumer Confidence Drops at Sharpest Pace in 3-1/2 Years
Consumers are concerned over inflation. Recession should be the bigger fear.
February 26, 2025: New Home Sales Plunge 10.5 Percent in January From Upward Revision
New home sales have been mostly sideways at a weak level, in a choppy fashion.