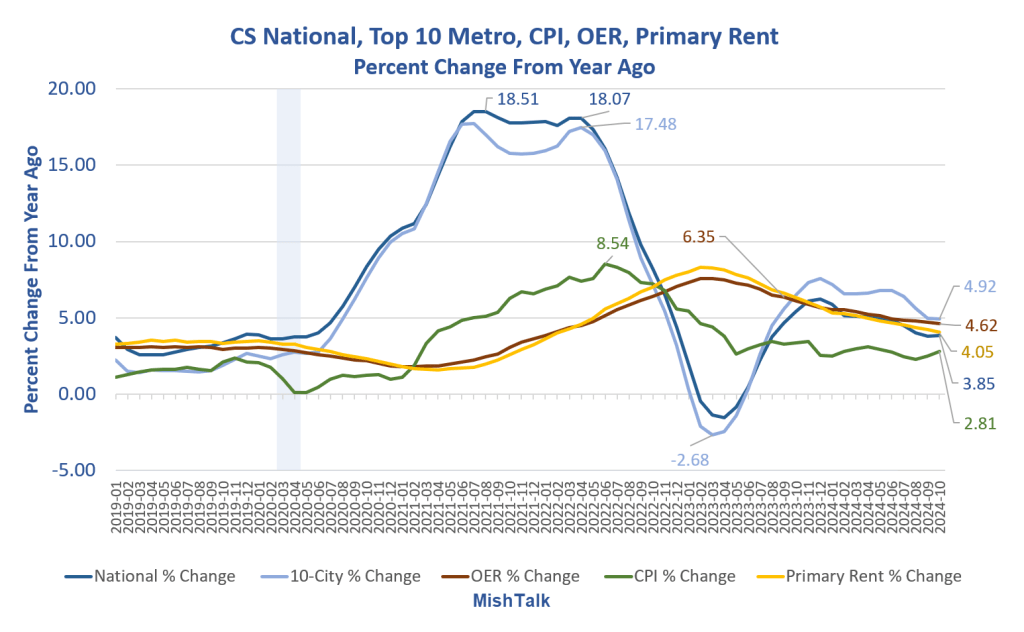
Would be buyers can definitely curse the Fed over this housing debacle.

Percentage Increase Since January 2020
- Case-Shiller National Index: +50.9%
- Case-Shiller 10-City Index: +50.3%
- Consumer Price Index (CPI): +21.1%
- OER is the BLS measure Owners’ Equivalent Rent, the price one would pay to rent their own house in lieu of owning it. +27.5%
- Rent of Primary Residence: +25.6%
CPI Inflation Indexes Understated
The Fed and economists in general do not consider home prices as part of inflation. To the extent this is ridiculous (very), inflation as measured by the CPI is understated.
To counter my statement, the Fed and Economists will say housing is a capital expense, not a consumer expense.
So what? Does inflation matter or just consumer inflation? Common sense says the latter.
Year-Over-Year Chart

Year-Over-Year Percentages
- Case-Shiller National Index: +3.85%
- Case-Shiller 10-City Index: +4.92
- Consumer Price Index (CPI): +2.81%
- OER: +4.62%
- Rent of Primary Residence: +4.05%
Case-Shiller 10-City Metro

10-City Chart Notes
- San Francisco peaked at 816.9 in May of 2022. It’s now 764.2 down 6.5 percent. However prices are up 3 straight months.
- Denver peaked 647.3 in May of 2022. It’s now 634.5 down 2.0 percent. However prices are up 6 straight months.
Every other city is at or near record highs. The national and 10-city indexes also hit record prices in October.
Don’t worry. We don’t call this inflation. We pretend it’s not there or that it doesn’t matter if someone sees it.
Back in the Real World
Back in the real world, Credit Card Defaults Surge to the Highest Level Since the Great Recession
Credit card defaults are up a mere 50 percent from a year ago.
As defaults soar, please note Continued Unemployment Claims Make a New High for the Year
From August of 2023 until April of 2024, it was easy to find a job if you lost one. That has not been the case starting May of 2024.
Recession Indicator
I created a recession indicator using a moving averages of 15-weeks or longer unemployed.
For discussion, please see Two Recession Indicators, What Do They Say Now?
However, as with home prices, nearly everyone is convinced those indicators don’t matter either.
And who cares if the bottom third is going to hell as long as the top 10 percent keep spending enough to make it appear the economy is humming.
I attribute this amazing “on average” success to the dynamic duo of Bidenomics and Fednomics.
