BLS math is often peculiar. This month is a real doozie. Four charts.

Private vs Government Employment Notes
- Data is from the Household Survey as is the Unemployment Rate
- The BLS says wage and salary government employment rose by 785,000
- The BLS says wage and salary private employment rose by 133,000 and the nonagricultural wage and salary employment rose by 822,000
The numbers don’t total correctly.
The BLS explains: “Detail for the seasonally adjusted data shown in this table will not necessarily add to totals because of the independent seasonal adjustment of the various series. Updated population controls are introduced annually with the release of January data.“
A hat tip to ZeroHedge for pointing out the surge in government employment.
You can also see the recent surge in BLS Table A-8.
From January 1948 though December 1997, the numbers did total correctly. They haven’t ever since.
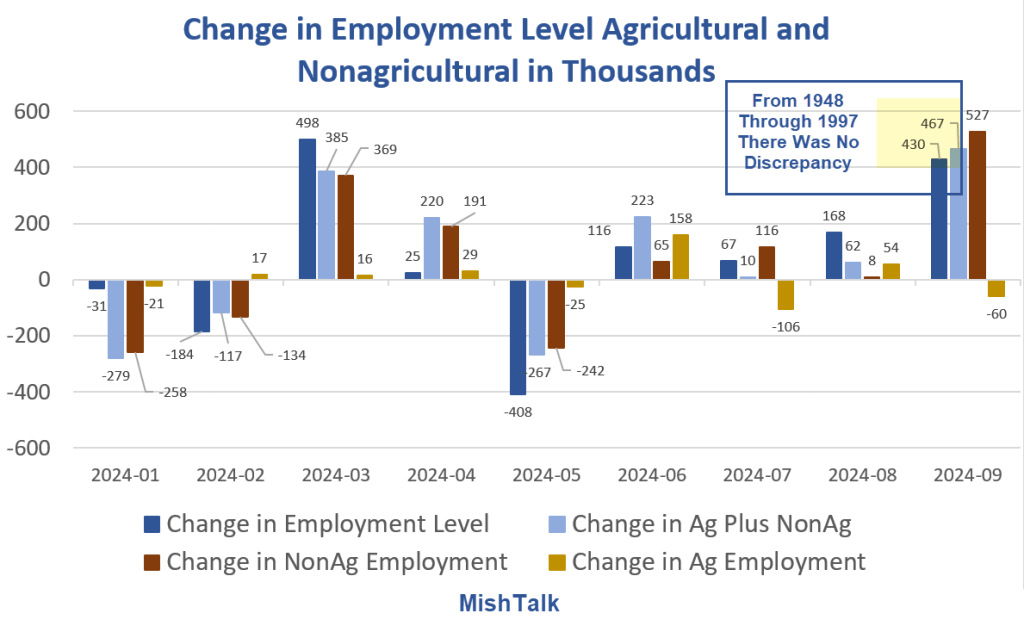
The same thing applies to agricultural vs nonagricultural breakdowns.
Change in Employment Level Agricultural and Nonagricultural

In September, the change in agricultural employment was -60,000 vs a rise of 527,000 nonagricultural employment. That nets to 467,000. The BLS reports 430,000.
Change in Government Employment Since 1948

Unemployment Rate Math
Because of the way the BLS makes its calculations, one cannot directly calculate (at least properly) the precise impact those government jobs had on the unemployment rate (UR).
However, we can show various unemployment rates based on employment level (EL) and Labor Force (LF) numbers.
The reported employment level in September was 161,864,000. That is up from 161,434,000 an increase of 430,000. The labor force is 168,699,000.
UR = ((LF – EL) / LF) * 100
UR = ((168,699-161,864)/168,699) * 100 = 4.051 which the BLS rounded to 4.1 percent.
If you keep the Labor Force constant you can calculate various Unemployment Rates by changing the Employment Level.
For example, if we assume the employment level was flat not +430,000 we can arrive at the following:
UR = ((168,699-161,434)/168,699) * 100 = 4.306 which the BLS would have rounded to 4.3 percent.
And if you believe this is all bogus nonsense gone haywire, then keep the Labor Force at 168,699,000 and plug in your own employment level based off the lead chart.
Establishment Survey Numbers

The Establishment Survey suggests we added 31,000 government jobs not 785,000 jobs. This is one area the BLS is likely sampling correctly.
A Breakdown, by Sector, of the Negative 818,000 BLS Job Revisions
On August 22, I gave A Breakdown, by Sector, of the Negative 818,000 BLS Job Revisions
Yesterday morning, I had difficulty finding the BLS job revisions. So did everyone else. Eventually the BLS posted -818,000 but my unadjusted calc of -915,000 is accurate too.
That 818,000 revision was to the Establishment Survey. The BLS birth-death model and/or small business sampling has gone haywire.
But if there is one thing the BLS is sampling correctly, that would be government jobs.
The BLS Reports Jobs Rebounded More Than Expected in September
On October 4, I noted The BLS Reports Jobs Rebounded More Than Expected in September
The BLS reports payroll employment rises by 254,000 in September. I discussed two reasons the report is suspect.
This report provides a third source of likely error.
Small Businesses Reducing Workers for the Last Five Months
Also see my ADP report Small Businesses Reducing Workers for the Last Five Months
ADP data shows small businesses with 1-49 workers have been reducing workers for five months.
I am confident something (many things?) went totally nuts in BLS sampling or assumptions, and the economy did not suddenly add 785,000 government workers in September.
However, BLS math is such that one cannot (should not) extrapolate total job losses starting from that 785,000.
The September report was garbage. They all have been garbage lately, but this one wins the blue ribbon for worst yet.
