I am very pleased to get a mention in the latest Hoisington Management Quarterly Review by Lacy Hunt.

The Global Capacity Glut
The Hoisington 4th-Quarter Investment Review is now publicly posted, Here are a few snips courtesy of Lacy Hunt. (Emphasis added)
Factories across the world are growing increasingly idle. Global industrial capacity utilization (CAPU) has fallen significantly, and a rising unemployment rate has followed suit, signaling that the available factors of production globally are progressively more redundant. The reason this is relevant is that since 1990, this thirty-four year correlation is consistent with the U.S. experience where data has been available for seven decades. As such, CAPU appears to be the dominant supply-side variable in determining inflation in the United States, China, Japan, U.K. and the EU.
CAPU – At Recessionary Levels
In the United States, CAPU has plummeted to levels lower than at the start of all of the cyclical recessions since 1967 (Chart 1). This vividly reflects a significant underutilization of resources, a circumstance which has historically led to moderating economic growth. Based on nearly complete fourth quarter 2024 data, the U.S. CAPU is estimated to have been 76.9%, a significant 3.2 percentage points lower than the post-1967 average and 6 percentage points below the historical level of 82.9%, which is the average entry level for the cyclical recessions. This surplus capacity reflects an irregular cyclical decline in industrial production from the fall of 2022.
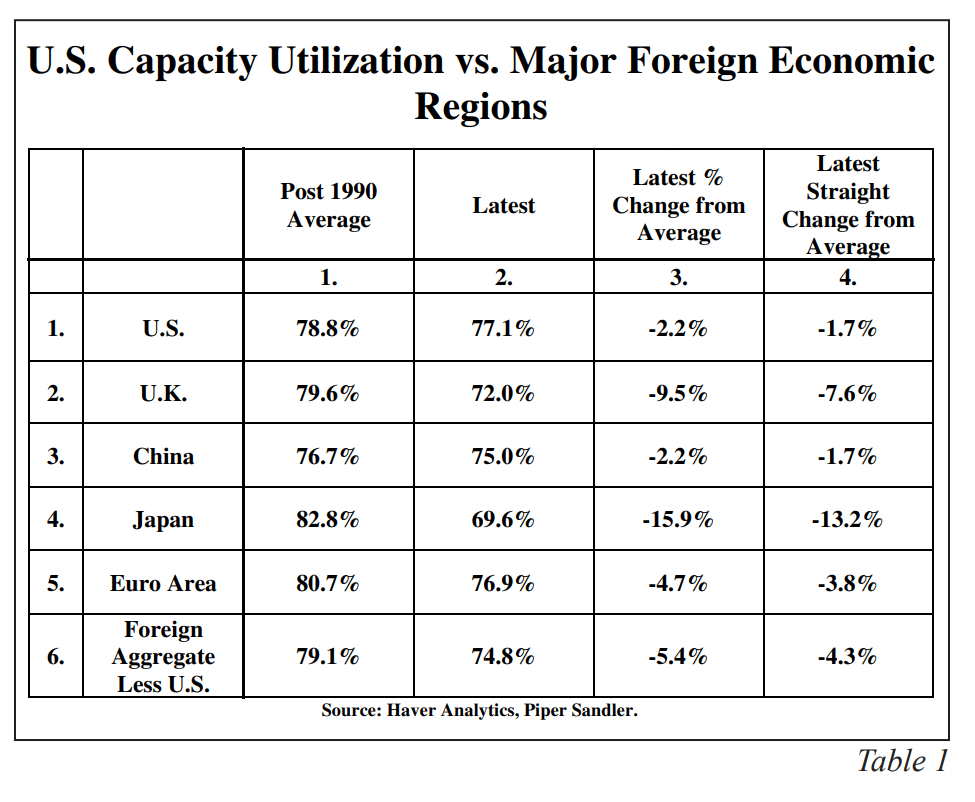
The estimated level of CAPU outside the U.S. in the fourth quarter was 74.8%, 4.3% lower than its post-1990 average of 79.1%. Since 1990, foreign CAPU has generally led U.S. CAPU.
As shown in Table 1, the latest CAPU in the U.K., the EU, Japan, and China were below their post 1990 averages by 9.5%, 4.7%, 15.9%, and 2.2%, respectively. This capacity glut explains why China, the world’s leading manufacturing economy, is experiencing outright goods deflation. With the yuan depreciating in the foreign exchange markets, China’s goods deflation is being transmitted globally.
US Capacity Utilization vs Major Foreign Economic Regions

Rising Unemployment: A Pivotal Factor in Economic Growth (
The U.S. unemployment rate (UR) has risen from a low of 3.4% in April of 2023 to 4.1% in December of 2024, an increase of 20.5%. This rise in unemployment was mainly a result of a highly noteworthy loss of six hundred twenty four thousand jobs in the private sector of the household survey, which reached its cyclical peak in 2023. The global aggregate UR for all five countries has also moved higher. By the end of 2024, the global aggregate UR had risen sufficiently to return to the level at the end of 2022, pointing to slower economic activity and weaker investment and, in turn, weaker consumer spending.
Three rules linking the unemployment rate to recession are worthy of discussion. These rules provide a framework for evaluating the lag between a rising UR and the magnitude of an increase in the UR before the start of an economic contraction. First, Edward McKelvey, a retired Goldman Sachs economist, found that when the current value of the 3-month moving average of the UR is subtracted from its 12-month low, and the difference is 0.2 percentage points or more, then a recession is likely to occur. Next, a former Fed economist, Claudia Sahm, found that the recession hurdle is for a difference of 0.5 percentage points, similar to McKelvey’s rule. Third, writing in the December 20, 2024, edition of ‘Mish Talk’, macroeconomic writer Mike Shedlock calculated a recession is triggered by a 0.015 percentage point difference between the current 3-month moving average from its five-month low. Shedlock’s procedure also eliminated recession calls when prolonged high unemployment was part of a continuing recession, not a new business cycle.
Shedlock’s rule was based on data dating back to 1948, a more extended sample period than either McKelvey or Sahm.
The McKelvey and Shedlock indicators currently exceed their recession entry levels. The Sahm indicator would be triggered by 0.1 percentage point increase in the 3-month average. Although widely rejected, the risk of an oncoming economic contraction remains elevated, an event that would further increase the overhang of excess capacity.
Thanks to Lacy Hunt for the mention.
Two Recession Indicators, What Do They Say Now?
For discussion of my recession indicator, please see Two Recession Indicators, What Do They Say Now?
I will do an update with the February jobs report, (January data).
