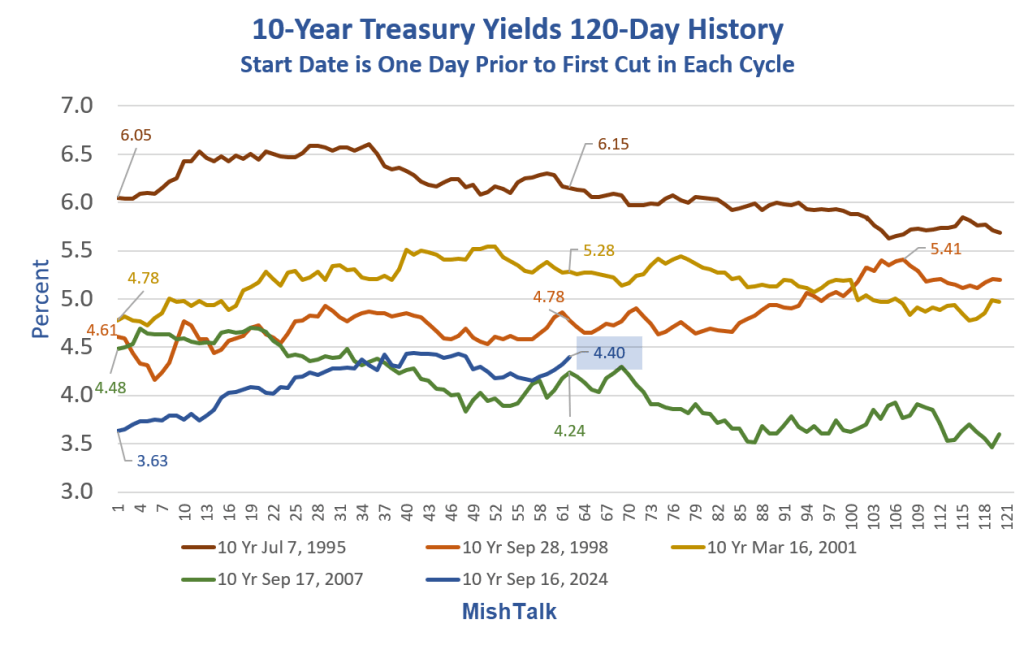
We are 62 trading days in from the first Fed rate cute this cycle. Let’s compare treasury yields to other cycles.

The above chart compares the reaction of 10-year treasury yields for 120 business days starting the day before the first rate cut in each cycle.
10-Year Treasury Yield Change at 62 Days
- 1995: 6.05% to 6.15%, +0.10 PP
- 1998: 4.61% to 4.78%, +0.17 PP
- 2001: 4.78% to 5.28%, +0.50 PP
- 2007: 4.48% to 4.24%, -0.24 PP
- 2024: 3.63% to 4.40%, +0.77 PP
Those are all the rate cut cycles since 1990, and that’s as far back as Treasury download data goes.
In the 2020 Covid pandemic, the Fed cut a total of 1.5 percentage points at its meetings on March 3 and March 15, 2020. These cuts lowered the funds rate to a range of 0% to 0.25%.
The Covid rate cut cycle, if you call it one, lasted less than 2 weeks.
Comparison Thoughts
Every cycle is different, but of the five cycles, the 10-year treasury yield reaction in 2024 is the most adverse for the first two months.
The most similar path is 1998 when the Fed had no business cutting rates at all.
However, in 1998 Alan Greenspan was worried about a Y2K collapse and feared all mainframe computer programs would collapse at the turn of the century.
Those rate cuts fueled a massive stock market bubble that collapsed in March of 2000.
Meanwhile, In China
Please see China’s 10-Year Bond Yield Hits New Record Low on Disappointing Data
The Japanification of China takes another big leap forward. And a huge fight with Trump is coming up.