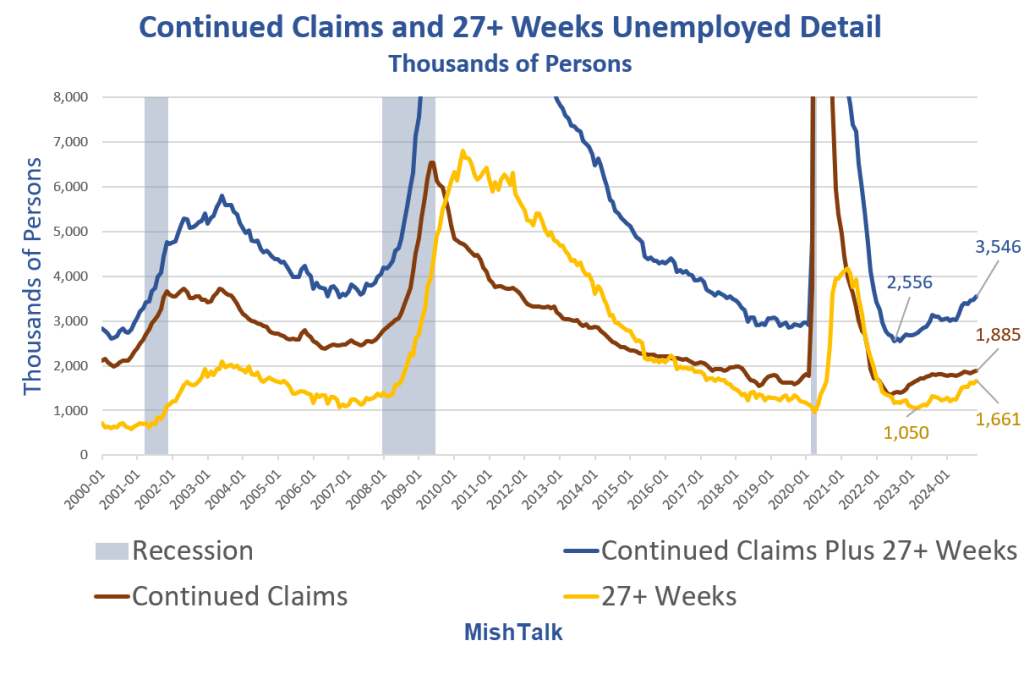
Department of Labor Data and BLS long-term unemployment numbers point to a rapidly weakening labor market.

The lead chart shows the monthly average of Continued Claims from the Department of Labor and those unemployed 27 weeks or longer from the BLS.
Initial Claims
- In the week ending December 7, the advance figure for seasonally adjusted initial claims was 242,000, an increase of 17,000 from the previous week’s revised level.
- The previous week’s level was revised up by 1,000 from 224,000 to 225,000. The 4-week moving average was 224,250, an increase of 5,750 from the previous week’s revised average. The previous week’s average was revised up by 250 from 218,250 to 218,500.
Continued Claims
- The advance number for seasonally adjusted insured unemployment during the week ending November 30 was 1,886,000, an increase of 15,000 from the previous week’s unrevised level of 1,871,000.
- The 4-week moving average was 1,888,000, an increase of 3,500 from the previous week’s revised average.
- This is the highest level for this average since November 27, 2021 when it was 1,928,000. The previous week’s average was revised up by 250 from 1,884,250 to 1,884,500.
Insured Unemployment
The key phrase above is “insured unemployment”.
After someone expires all of their unemployment benefits they become “uninsured unemployment” and the Department of Labor stops tracking.
Expiring Unemployment Benefits
- Most states offer 26 weeks of unemployment benefits.
- Many states with a maximum of 26 weeks use a sliding scale based on a worker’s earnings history to determine the maximum number of weeks they qualify
- Arkansas, Iowa, Oklahoma, South Carolina, Missouri, North Carolina, and Kentucky have a lower number of week.
- Massachusetts allows up to 30 weeks depending on conditions. Montana allows 28 weeks of benefits.
Insured unemployment generally ends at 26 weeks. To correct for expiring benefits, we need add those with expired benefits to the number of continuing claims.
Continued Claims and 27+ Weeks Unemployed Detail

Quarterly QCEW Data Provides More Evidence of BLS Jobs Overstatement
On November 20, I commented Quarterly QCEW Data Provides More Evidence of BLS Jobs Overstatement
My prior comparisons and advance calls suggest we see negative revisions in nonfarm payrolls from 2023 Q2 to 2024 Q2 of well over one million. My initial stab is about 1.2 million to the downside.
The BLS Birth-Death model is seriously messed up an/or the BLS is oversampling large corporations and under sampling small businesses.
The BLS monthly nonfarm payroll reports are consistent garbage.
Reflections on BEA Revisions
If jobs are overstated, income is too. And on Wednesday we found out the BEA overstated wages by a massive $91.8 billion from $156.8 billion to $65.0 billion.
Please note the Huge Negative Revision of $91.8 billion to Second-Quarter Private Wages
The BEA commented “With the incorporation of these new QCEW data, real gross domestic income is now estimated to have increased 2.0 percent in the second quarter, a downward revision of 1.4 percentage points from the previously published 3.4 percent estimate.”
I commented “The BEA hugely revised GDI to the downside. Hmm. It seems that voters weren’t fooled.”
Click on the above link for more details and charts.
Small Business Employment in Pictures
Finally, please consider The 2024 Destruction of Small Business Employment in Pictures
Small businesses with employees 1-49 are struggling in 2024. Large businesses are booming [but for how long]?
Inflationary or Recessionary?
There are a huge number of factors in play depending on what Trump does with tariffs, what Trump does with deportations, how much inflation the Fed is willing to tolerate, and how much the Fed reacts to Trump’s jawboning.
Tariffs and deportations are simultaneously inflationary and recessionary depending on the time frame and how fast Trump does or doesn’t do what he has pledged to do.
Neither Trump nor the Fed is in a good position, especially with Stubborn CPI Data.
